No changes to our short, intermediate, or long term forecasts for bitcoin at this time. The price, still stuck around 230 $, has moved less than $3 since yesterday’s update, and remains firmly entrenched in this new consolidative range. We are still expecting a move higher to tag the 236 $ area prior to a more substantial selloff to retest critical levels between 200 and 220 $. While we think this move will materialize in the not too distant future, we have a feeling that price will remain subdued within the range through the bulk of the weekend.
That said, we will be watching for a slight increase in volatility starting Sunday afternoon as the foreign exchange markets anticipate the US Fed meeting early next week. We should be able to glean some insight into what the US dollar will be doing at that time which will positively inform our short term outlook for bitcoin. Stronger dollar means weaker bitcoin, and a weaker dollar could give us the push to 236 $ we have been looking for.
No need for a new chart today as the 4hour from yesterday’s update remains representative of current market conditions. We are still watching for sell signals if/when price reaches the 236 $ level, however if the local 227.48 $ low cannot hold though the weekend then we expect to see 220 $ tested yet again.
Bitcoin prices continue to rally despite a highly unfavorable technical landscape over the short to medium term. We can’t help but think that a large portion of these incoming funds are buying coins in anticipation of a Greek exit from the Euro Zone (“Grexit”), or at the very least tight capital controls and potential bank runs in Southern Europe. While this is a perfectly legitimate reason for a rally, and is an example of one of the more compelling use cases for bitcoin, these types of scenarios almost always end with a “buy the rumor, sell the news” type of climax that catches most players offsides.
Besides the Euro drama, it also appears as though Google search trends for bitcoin and blockchain are increasing substantially in spite of the fact that the media coverage of cryptocurrency continues to be skeptical at best. While we think a true breakout rally above the 250 to 260 $ key intermediate term resistance range is unwarranted and unlikely due to the current block size controversy and extreme buyside leverage on Bitfinex, however we cannot rule it out as a possibility given the exogenous macro environment.
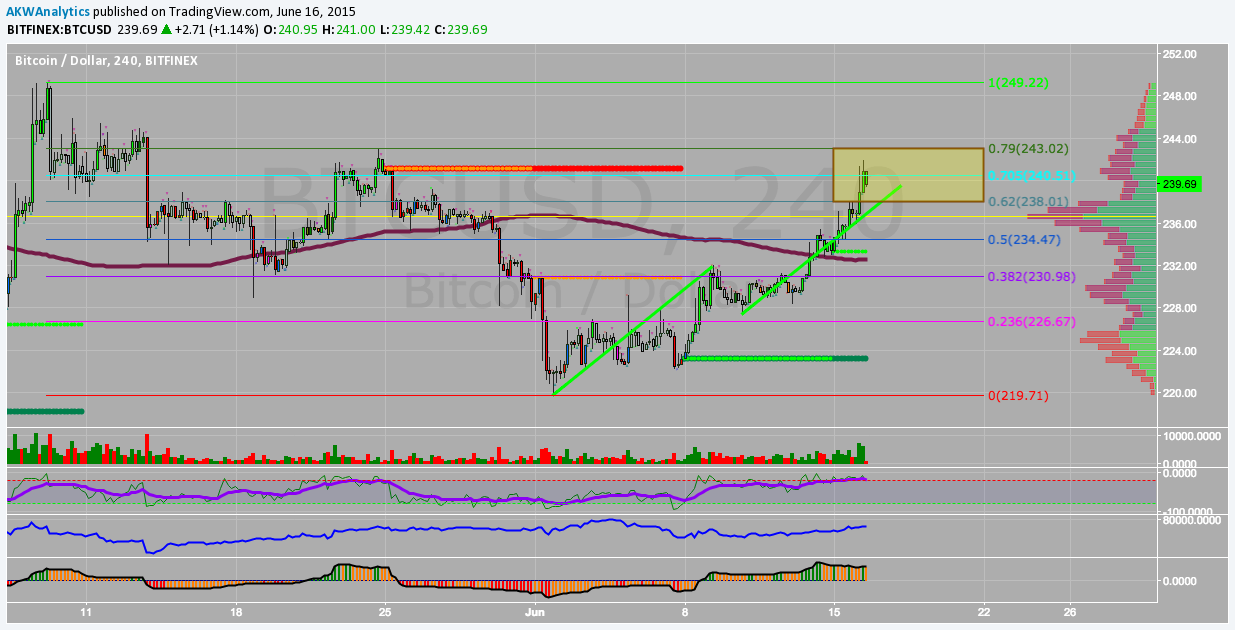
Technically speaking, things look overbought and ripe for a pullback, but they have looked that way for the past three days. That said, if we take a look at the 4hour chart below we can see that price is now in an even juicier short zone than it was on the hourly chart from yesterday. We have a stupid overbought Willy, divergent A/D and volumes, price is right at the 70.5% Fibonacci level (OTE short sweet spot), and the larger bull AB=CD has completed (overshot, in fact).
At this point, we feel good about staying in the (NEW) short ProTrade that was issued yesterday given our stop at 242 $ was missed by $0.01 and price has subsequently pulled back down slightly below 240 $. We will now move our stop to the top of the OTE short zone (79% Fib) at 243 $, as if this is taken out prior to a retest of support around 230 $ then we will take the loss as prices rise to the 250 $ resistance level. If that get taken out, we may be in a LT reversal, but it is still too early for that kind of talk. One thing at a time…
While it is never a pleasant thing to admit when you are undeniably wrong about something, at least we can take some solace in the fact that we kept our losses small relative to how this rally has materialized. Although we are still unsure about what is causing the buying frenzy, whether it be Greece, short covering, or real institutional demand, we are sure that price is now at the most important technical resistance level in months.
Following a brief pause around the 250 $ area yesterday, the market bought the dip aggressively which led to the overnight rally which we are now pulling back from. As we have been saying for months, the bear market/consolidation will not be over until 262 $ in taken out on volume and holds, followed by a break of the 300 to 320 $ range which is where the bear would officially be slayed. We are not ready to make that call yet seeing as how the technicals are extremely overbought in the short and medium term, however the longer term charts still look constructive as the double bottom around 220 $ ended up holding firm.
At this point we want to let the market tell us what it wants to do. If we see a legitimate break above the 262 $ level on a volume spike, then we will be looking for places to get long once that breakout pulls back to support. If the bulls cannot muster the strength to penetrate these key resistance levels, however, then we see a more substantial pullback coming as the market returns to the price from which it came (in this case that price is ~230 $). Having said all that, bitcoin is still stuck in an intermediate term range between 210 and 260 $ so we will be hesitant to trade until we see clear signs that the range has been broken.
Another thing to keep in mind if you are trading today is that the FOMC statement will be released at 2pm EST, which will inject some volatility into the currency and commodity markets (bitcoin included). A hawkish statement would boost the US dollar and would put pressure on bitcoin to move back down to support, while a dovish statement would push the dollar lower and keep bitcoin prices elevated.
Now, whether that life takes the form of a rally continuation up to key resistance levels
or it materializes as an opportunity to sell coins at the top of the still intact trading
range between 210 and 260 $, remains to be seen. However, the longer term charts
are saying that a bigger move is on its way, and perhaps it will be to the upside.
Having said that, and before folks run out and mortgage the house to leverage buy
coins, we think that the pause we are currently seeing could have more room to the
downside as the large gains by the bulls over the past few days are consolidated. If
the market can slide lower to the 240 $ area and hold there, then we think 262 $
has a realistic shot at being taken out and we head higher. On the other hand, if
240 $ does not hold on the selloff, then a retest of 230 $ would be in the cards.
The final scenario is that Greece leaves the Euro over the weekend, or at least
implements capital controls, and bitcoin prices skyrocket to the 300 $ heavy resistance
area. While we do not think this is likely, we do think it is possible (~30% prob).
Given the number of possible impactful events regarding bitcoin’s price that are
coming over the weekend, and the uncertainty which is present globally over Greece,
we want to remain neutral and keep our powder dry for the real move, whether
that be up or down. For now, we want to see how the geopolitics play out…
Chop, chop, chop goes the market maker wood chipper as both bulls and bears have been mulched over the past few days. Although range bound markets are the most frustrating of trading conditions, It now appears as though the short term technicals are back in control (a very good thing). This tells us that the market is likely finding a new, higher equilibrium price which would indicate another leg to the upside once the current consolidation has run its course. We are now there yet, however, as the 240 $ to 250 $ range is now firmly established.
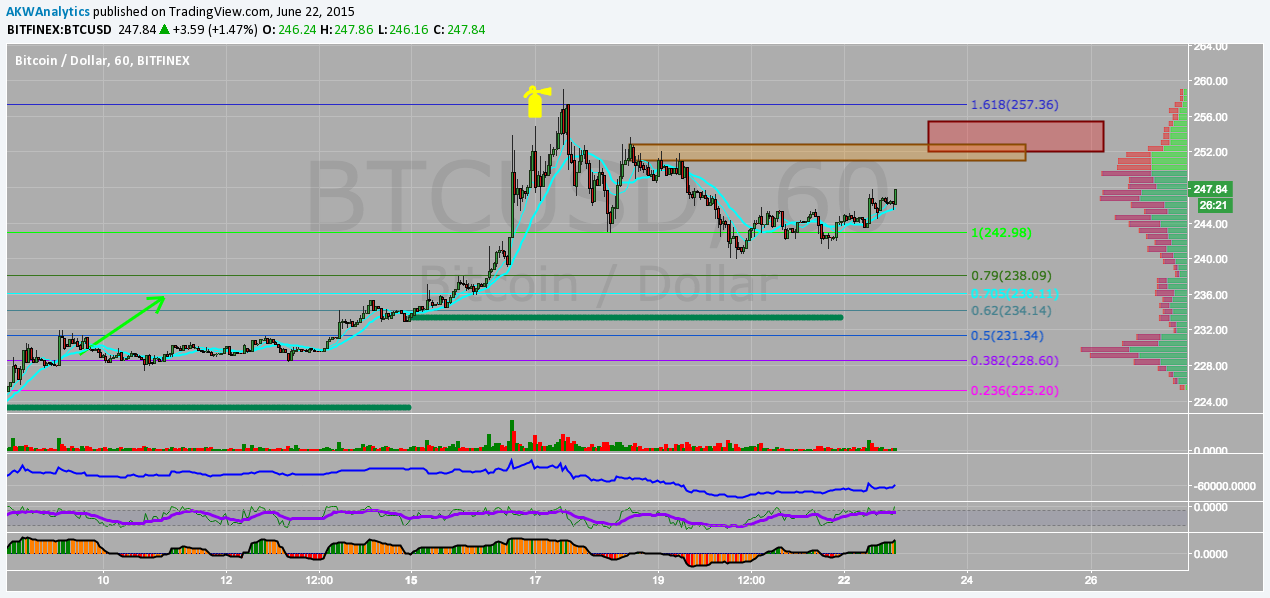
Technically speaking there are some interesting things happening concurrently. First, and most immediately relevant, is that this rally off of the 240 $ low is getting overbought quickly as it approaches both an institutional supply area (orange rectangle) as well as the OTE short zone (red rectangle) off this entire corrective move. Next is that sell volume has been surprisingly low as A/D begins to show a pick up in accumulation. Again, bullish. Lastly, The recent move up to 259 $ ripped through our OTE short sweet spot like tin foil, but where it did stop is even more intriguing. Almost to the penny, the top of the rally was right at the 161.8% Fibonacci extension level, only slightly wicking above that level in a blow off, parabolic top.
This final point is the one we think has the most potential for long term implications. The type of move bitcoin just had was eerily reminiscent of the ones we see on a daily basis in the legacy foreign exchange markets. Sharp spikes higher that ignore overbought/oversold indicators and stop on a dime at institutional take profit (TP) fx levels like the 161.8%, indicate that more and more institutional money is slowing leaking into bitcoin. This is just one of many signals we have noticed that point to smart money flows finding their way into bitcoin, but this is simply the most recent example.
More to come, and perhaps a ProTrade, if we can get past 250 $ again and hold. Until then, steer clear of the woodchipper.
Paralysis has once again gripped the bitcoin market as prices have failed to move out of our pre-identified range. Despite a spike selloff down to the 239 $ level on decent volume, the bears could not hold price down there for even a entire hour. By the same token, once the false breakdown was confirmed and price was able to recapture the 240 $ level, the bulls failed to push price back up to resistance around 248 $. Seems to be a loss by both sides, meaning a continuation of the range until we get a more substantive move.
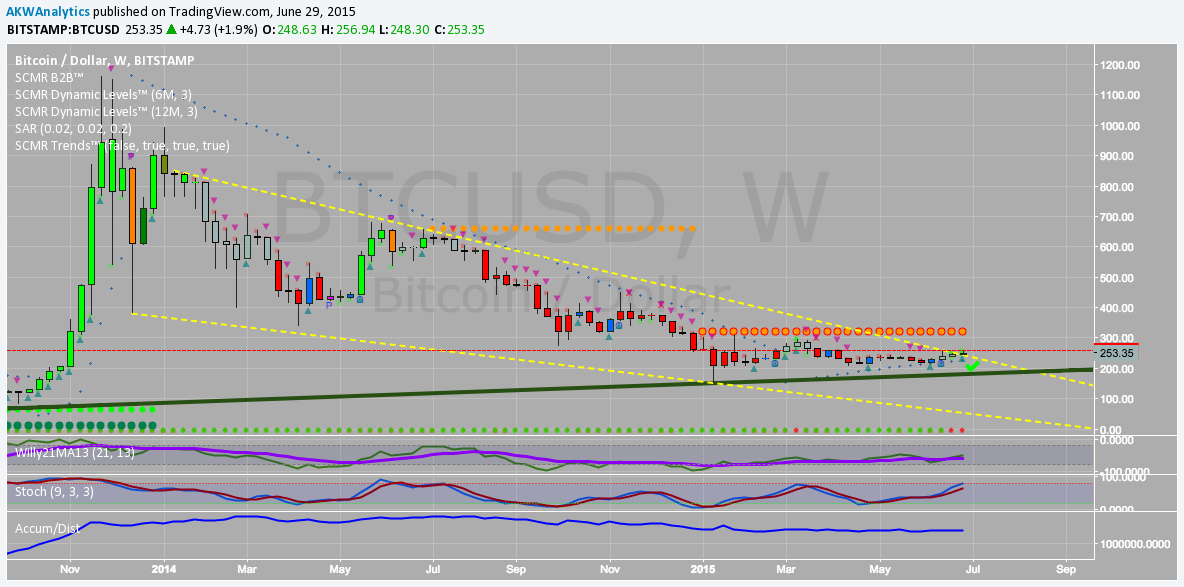
Technically speaking we have some interesting things happening on the weekly chart that could influence where we head over the next few weeks to a month. First of all, we can see that price remains in the descending wedge, but is right at the very top of the formation. This also happens to be right where historical horizontal resistance comes in from the April '13 bubble top at 259 $, and is the local top from the recent parabolic rally we had. If that 259 to 262 $ resistance area can be broken on volume and hold the top of the wedge on a test, then we truly may be looking at a multi-month trend change. Until then, the range rules.
Second thing to notice is that two weeks ago SCMR Trends painted a blue candle (potential reversal), then last week it painted a bullseye (confirmed reversal), and this week we have an “X” (confirmed reversal rejected). It sounds confusing, but bottom line is that if we still have an “X” painted over this week’s candle by Sunday evening, then we could be looking at a failed breakout. This would mean a retest of lower levels is coming, most likely down to the 225 to 230 $ support range.
The last features of the chart we want to point out are the indicators, which are relatively bullish for the most part. We have a Willy that is still well below -50 but is moving out of oversold territory, a stochastic that is showing bullish momentum, and an A/D that has flatlined during this extended consolidation. Additionally we have a firmly bullish Parabolic Sar adding support around the 220 $ level, however SCMR 6month and 1year resistance still lies at 320 $ which is where the real battle will be fought (if we can get there).
All in all, we are maintaining our neutral stance with a slight intermediate term bullish bias. That said, the impotence of the bulls over the past 48 hours has turned us somewhat more negative on the very near term as perhaps another bear attack in necessary to scare the bulls out of their complacency. Again, watch the current range of 239 $ to 252 $ as if this remains intact, then price will stay rangebound. However, if 239 $ is broken on volume and fails to bounce quickly, then we think its reasonable to expect a small pullback to the first support area from 225 to 230 $ over the next 7 to 10 days. After that, and if 220 $ can ultimately hold, then we think the chances for a much more substantial rally up to the 300 $ area is completely realistic.
Until then, patience remains our most precious virtue, and dry powder our most valuable resource…
What has occurred over the weekend in the price of bitcoin should come as no surprise to our readers. While we were expecting the price to remain within the 239 to 252 $ trading range with a bullish bias towards the top of the range, headlines out of Europe (Greece and Germany) were able to create some FOMO which pushed the rally up to intermediate term resistance around the 260 $ area. Until the 256 and 259 $ local highs are broken, and 262 $ is taken out on volume, then bitcoin will remain rangebound and choppy. However, given the longer term technical setup there could be significantly more upside in the near future IF these levels can be broken in the near term.
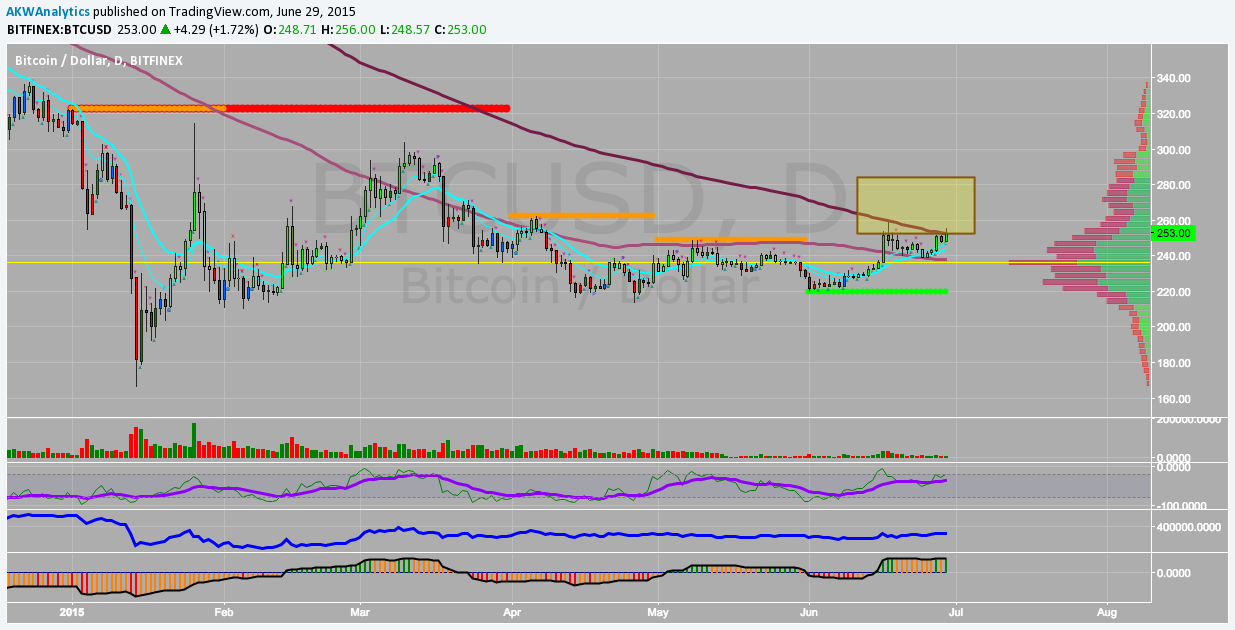
Getting to the technicals, we want to take a look at two charts which tell the medium and long term stories well. First up is the daily chart, which is now entering a strong resistance zone. The yellow area we have highlighted on the chart represents the OTE short zone off the of 155 to 315 $ rally early in the year, as well as a bearish order block and the 200day MA. The indicators are also mixed with Willy getting near overbought, ergotics exhibiting a small bearish divergence, and A/D showing a continuation of the accumulation of coins. Putting all of this together tells us that getting through the 256, 259, and 262 $ resistance levels will be tough in the very near term, and in fact price will still be well within a strong sell zone until the 280 $ area is tested and broken. The next few weeks will be critical in determining whether we are undergoing a true trend change or just a countertrend bounce.
Next up is the weekly chart, which we referenced directly in last Friday’s update. We can see that the weekend rally allowed price to get high enough to keep the confirmed reversal intact (no more “X” above last weeks candle), which is a very bullish sign. Adding to the bullishness is the fact that, for the first time in well over a year, price is now above the descending wedge with plenty of room to run to the upside according to the momentum and volume indicators. If the bulls can hold current levels for long enough to clean up the short term indicators, then we have little doubt that the 259 to 262 $ resistance zone will at least be tested over the course of this week.
Overall, the price action over the past few weeks has reaffirmed our generally bullish bias, but has yet to move far enough in either direction to force us from our neutral positioning (hence no ProTrade yet). Presently, we are still within a wider trading range between 220 and 260 $ so we want to keep our powder dry. In fact, if the bulls cannot muster the strength to breakout of this range in the next 7-10 days, then a retest of the bottom of this range would become the preferred scenario. Until then, we will continue to stay patient as the market consolidates recent gains.
Днес, 30/6 в 16:40 за първи път от доста време насам, едни от най мечо-настроените анализатори в интернет - Булбеър аналитикс, за първи път - макар и с половин уста - съветват за покупка на биткойн с нагласа за официален сигнал в очакване на малко по-изгодни нива. Ето анализа:
Market Commentary (BTC):
Thar she blows!!! Following days of consolidation at elevated levels, bitcoin prices finally broke through resistance in the 259 to 262 $ area. Price hit a local high of 268.10 $ early this morning, but has since pulled back to prior resistance (now support) around 263 $. Ideally, for the bullish scenario at least, we would like to see price calm down here and consolidate at current levels prior to moving higher to the next heavy resistance area from 275 $ to 288 $.
Given buy volumes, price action, and the longer term technicals we think the rally still has some room left to run to the upside (280-300 $), however we want to wait and see if we get a pull back to support in the 245 to 250 $ zone before getting long on a ProTrade. That said, risk seekers can get long around the 262 $ level for a move to retest the local highs around 268 $ with a tight stop around 259 $.
Additionally, with low liquidity caused by a holiday shortened week (and summer trading environment), uncertainty surrounding Greece and the Eurozone, and short term overbought technical conditions we think it best to remain on the sidelines until either July 4th has passed and support has held, OR support breaks and we can catch a long on a panic dump. Otherwise, we expect price to consolidate gains through the long weekend in the 255 $ to 265 $ range, which we do not want to trade as it is a return to the market maker chopzone.
As expected, bitcoin prices have stabilized somewhat following what became a sentiment-driven rally top at 269 $. Shortly after issuing our update yesterday the market did indeed move back to retest that high, so if you would have taken our “risky” trade recommendation you would have made a quick ~6 $ on the scalp. Today we find ourselves hovering around initial support following the bull failure at 270 $, but we would like to see more consolidation before hopping back in on the long side.
While the longer term charts remain very bullish, the medium term ones are overbought which is typical in bull markets (if, in fact, that is what we are now entering). That leaves us to rely more heavily on the short term than we would prefer, but at least we have a decent directional bias to work off of for the first time in months (feels like years).
The hourly chart provides us with a good look at the setup. First thing to note is the divergent double top at 269 $ within a head and shoulders that foretold lower prices. We can see that the market is now finding support right at the previous supply zone (resistance becomes support) and volume profile notch around 252 $, but we still do not want to buy this quite yet. What we want to see is price move down into the OTE long zone off of the 239 $ rally low, which is also where the rally trendline lies, a huge VP notch sits, and would washout stops below the 247.25 $ local low. A stop run to the downside would also send Willy and the Stochastic into very oversold territory while at the same time A/D continues to show steady accumulation of coins through this pullback.
We must admit that price action and order flow has been very bullish over the past few days therefore we would not be surprised to see the top of our resistance zone in the 280’s $ tested in the not too distant future. In fact, 300 $ might have a technical bullseye on it as it is now a confluence zone and is important as a psychological round number. Lets wait and see how this consolidation plays out, but stay long if you are long and look to get long if you are not (as per the trade below).
Bitcoin remains in a rangebound consolidation between 250 and 265 $ as we approach a bank holiday/long holiday in the US for the 4th of July. While we expect some volatility today with a slew of economic data being released, including NFP, we think price will remain stuck between the supply and demand zones denoted on the hourly chart below until Sunday. If we do temporarily breakout of this range over the next three days, then we expect it to be a false break to the downside that we will use as an opportunity to enter our long ProTrade down in the 245 $ region.
Technically speaking nothing has changed from yesterday other than a turn in the short term momentum indicators which are signaling a retest of the top of the range around 262 $, but we expect price to selloff once again prior to a breakout in order to trap bears on a fakeout down to our support/buy zone (hence the ProTrade).
Longer term we remain cautiously optimistic on a potential bullish trend change, but are still not yet ready to call a definitive cycle bottom at 166.45 $ due to an unresolved LT Elliot Wave pattern. It would not surprise us one bit to see this rally continue up well past 300 $ only to selloff sharply once euphoria hits in order to slaughter the bulls one last time before its all said and done. This is not a call, it is a possibility, but we wanted you to be aware of it if you are going to trade the action this weekend.
Ето виждането на Bullbear, те винаги искат да влезнат когато цената коригира, но като цяло в момента май е най-добре да си седим върху биткойните и ако може да заредим ако падне с $10-$20 тази седмица:
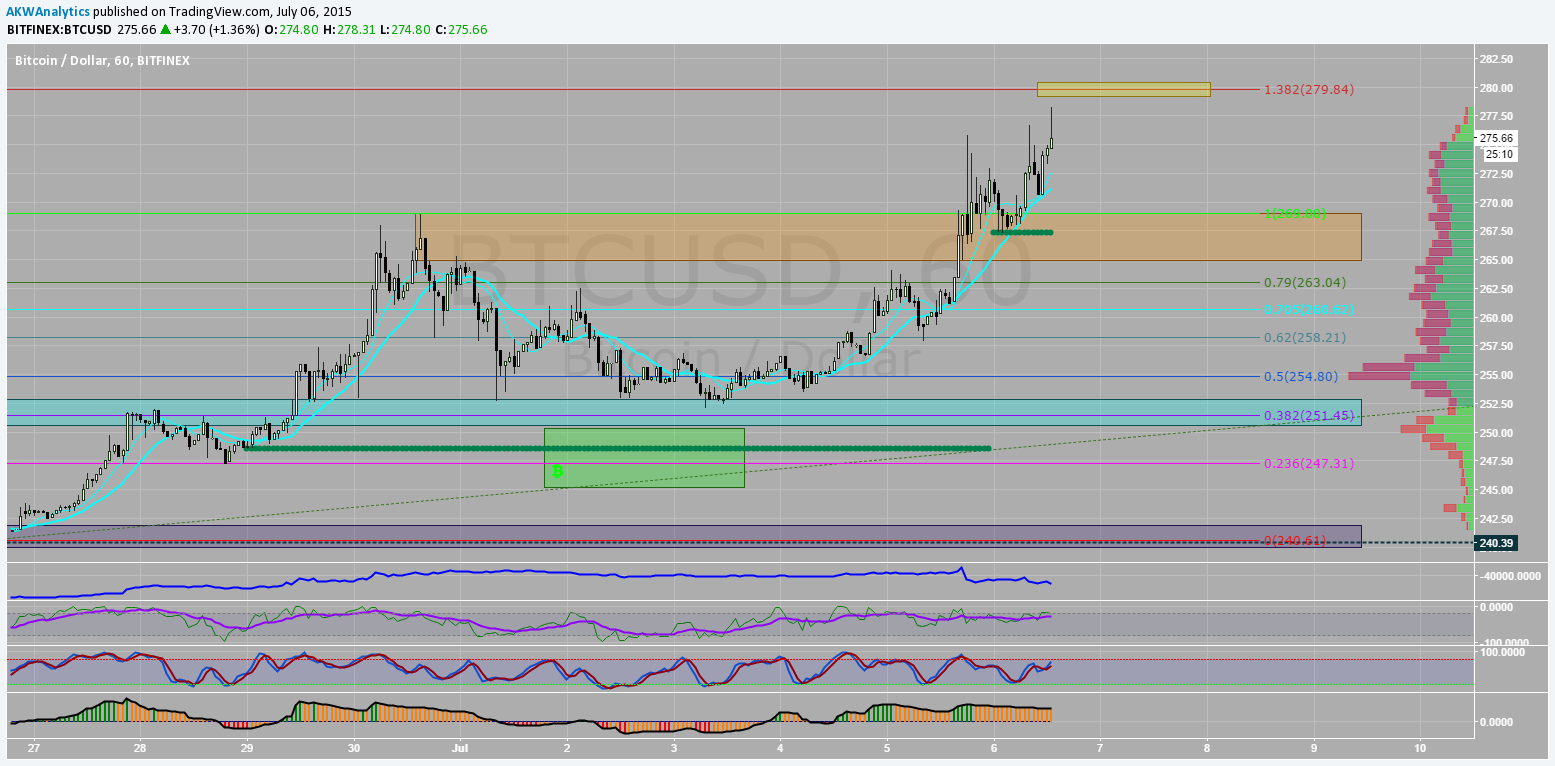
17:00 часа, 6 юли, 2015, цена $275
Market Commentary (BTC):
Unfortunately, price was not able to make it down into our ProTrade buy area over the weekend as the “No” vote in the Greek referendum created more uncertainty about the future of the EU. Investors continue to speculate as to whether an official Grexit will lead to more currency volatility, capital controls, and perhaps an exodus from the Euro althogether by other PIGS nations. While we think this chain of events would be very good for the bitcoin bulls, we think this process will take more than a few days, while at the same time that the charts are showing some serious resistance immediately overhead.
Turning to the hourly chart we can see that following a nice saucer bottom around 252 $, price broke out above the previous supply zone to the upside on good volume. SCMR is now showing that the old resistance area is now support around at the 267 $ level. Despite this ST support, the momentum indicators are telling us that at least a sideways consolidation is needed to recharge, if not an outright selloff down to stronger support levels around the 250 to 260 $ area. Additionally, price is approaching the 1.382 Fib extension off of the previous up leg, which will provide near term resistance, as well as the top of the longer term daily OTE short zone which comes in around 285 $. If you are long, this is where we would be taking profits in order to get some dry powder ready for the pullback.
If you have not been in a position during this move, we think this week will provide an opportunity to get back in at lower levels than we currently sit. the 250 to 260 $ range is what we are now watching as this would allow the ST indicators to get cleaned up while still holding above the 100 and 200 day MA’s. It is also the OTE long sweet spot off of the weekend rally. That said, if it appears as though all we will get another shallow retracement before the next move up, then we will issue a quick ProTrade update to adjust the entry levels higher. If not, and the market does what we think it will, then we want to stay patient and wait for price to come to us.
Здравейте, от 2 месеца вече се запознавам с биткойна по-подробно. Преди години не вярвах на това нещо. Искам да питам защо в сайта се предлага покупко-продажба за около 7 хиляди лв. а днес по пазарите той се търгуваше за 4000-4500лв?
Искам да попитам каква е разликата м/у XBT и BTC (гледам графиките в tradingview.com). Примерно графиката XBT/EUR се различава от BTC/EUR (същото важи и за XBT/USD и BTC/USD). На всякъде пише, че и XBT е bitcoin и BTC е bitcoin, но графиките се различават.